PRODUCT
Commodities Intelligence is an application on Thomson Reuters Eikon™ platform and part of the “Intelligence” series (cf. Healthcare Intelligence) that provides curated oil and gas information such as refineries and pipelines, to researchers and investment bankers focusing on the commodities industry. The app targeted a new customer segment.
Design Highlights
Pitched the hypothesis and some market insight to leadership and received funding twice to investigate then build
Customer survey revealed a broken workflow
Dashboard offering a birds eye view of the oil & gas industry
Quick search by company (a key need)
Integration of extensive industry data from outside databases
“I had no idea Thomson Reuters had this content!”
The Challenge: an audience with a broken workflow
“Our Commodities offering is currently designed primarily for traders and not investment bankers. Traders look for recent industry data for rapid trades,” said Victor E., Thomson Reuters’ Business Development Director for Eikon’s platform. “Instead, we can target investment bankers and research analysts that cover Oil and Gas companies and need a long-term view of the industry. This is a sizable user base of around 8,000 users globally, who are currently getting this content from a wide range of sources.”
The Hypothesis
By leveraging TR’s existing Commodities content and re-positioning it to facilitate company-level analysis, we can address this broken workflow.
Target Users
Investment bankers
Research analysts
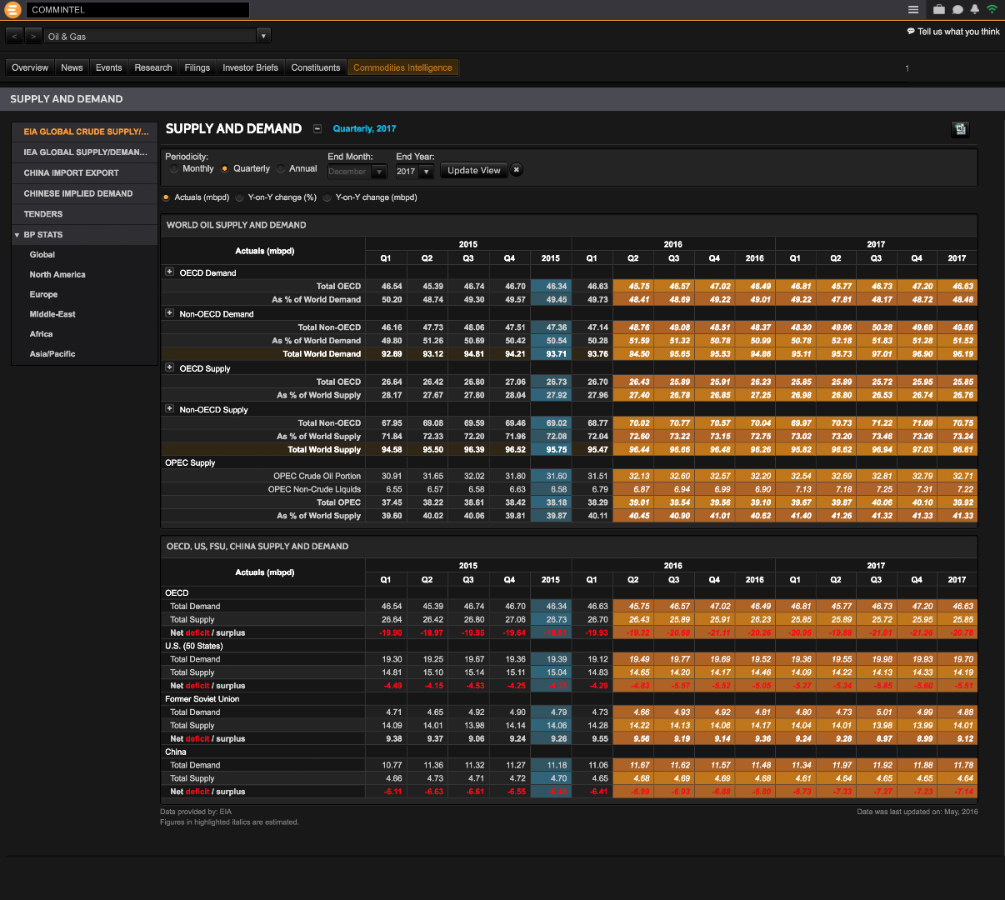
original eikon commodities data
Design Process
Customer Survey
We interviewed 12 investment bankers and research analysts, currently users of the Eikon platform to test our hypothesis. We inquired about the type of data those customers are looking for to make buy, sell or wait decisions on the industry, where they are getting this data from, and how they synthesize this data. We also listened to the workflow they go through, their painpoints and wishes.
We validated our assumption that users have a unique need for detailed oil & gas production information, including refineries, vessels, pipelines, storage terminals, etc. They need a long-term view of the market.
Key Painpoints Expressed
Lack of consolidated data
Inability to search directly by company, ie. Exxon Mobile (versus by commodity, ie. Brent crude > company > Exxon)
interview notes sample
“It would be more interesting to see historical data of outages and production capacity for a given company.”
The Data
To answer the lack of relevant data in Eikon, we discussed solutions with engineers and matter experts, and found that critical data existed in TR’s other financial databases Perm ID and Organization Authority! We decided to create an API into our solution extracting data from these two databases. A quick look at the data indicated that the data format was inconsistant across databases and required reformatting. This effort was cumbersome and took 2 months to finalize, requiring some iterations in the designs to adapt to long strings of content.
Ideation
Based on those insights, we ran an ideation session where we delivered:
A dashboard to easily view all the data in relevant charts
Search by company
Narrow down the information
Access detailed reports on companies, refineries, pipelines, storage terminals etc.
wireframe
Final Designs
Three rounds of design iterations concluded in the delivery of these 3 key features:
Dashboard with interactive charts
Search on the homepage
Search results page with faceted search
We followed the look and feel of Eikon, using its design guidelines and asset library to implement a clean and simple UI. We also took advantage of the high contrast color palette, to design interactive charts, especially noticeable in the dashboard.


